Alerts Dashboard
Sentinel workbook for monitoring alerts and incidents.
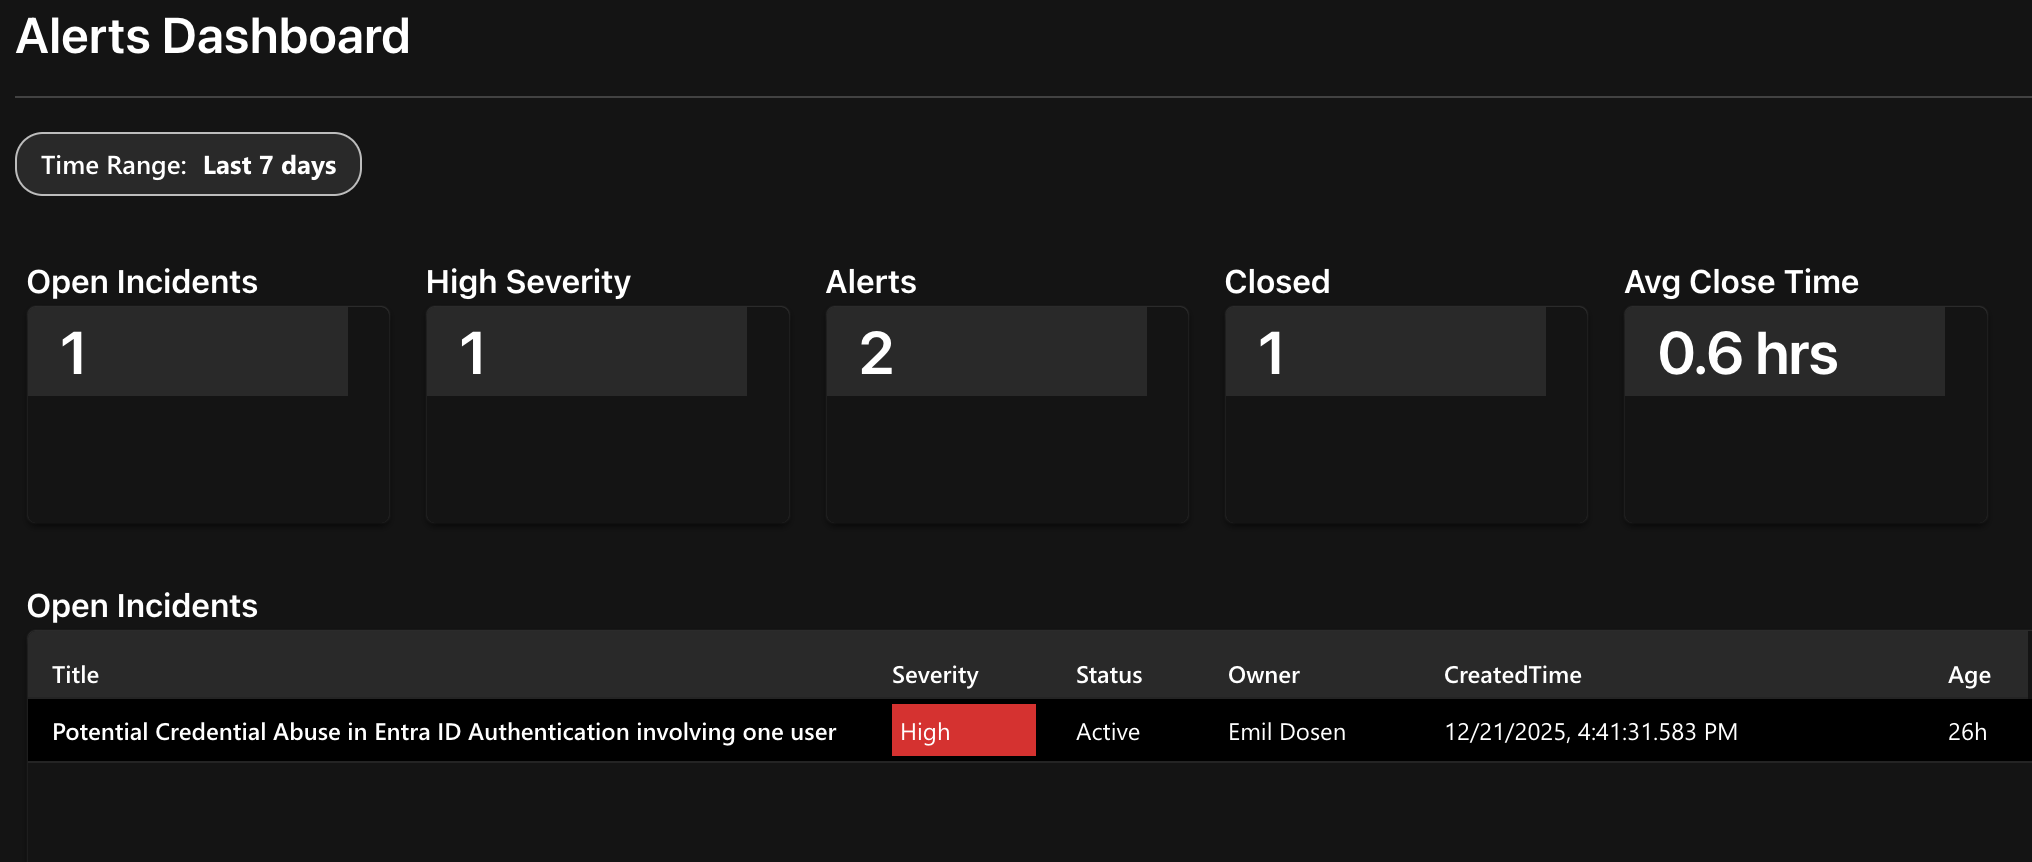
Sections
- Overview: Open/closed incidents, high severity count, alerts, avg close time
- Open Incidents: Table of current open incidents
- Alerts: Volume trend, severity breakdown, product breakdown, top rules, recent alerts
- Entities: Top accounts, hosts, and IPs appearing in alerts
Requirements
- SecurityIncident table
- SecurityAlert table
Template
{
  "version": "Notebook/1.0",
  "items": [
    {
      "type": 1,
      "content": {
        "json": "# Alerts Dashboard\n---"
      },
      "name": "title"
    },
    {
      "type": 9,
      "content": {
        "version": "KqlParameterItem/1.0",
        "parameters": [
          {
            "version": "KqlParameterItem/1.0",
            "name": "TimeRange",
            "type": 4,
            "isRequired": true,
            "typeSettings": {
              "selectableValues": [
                { "durationMs": 3600000 },
                { "durationMs": 14400000 },
                { "durationMs": 86400000 },
                { "durationMs": 259200000 },
                { "durationMs": 604800000 },
                { "durationMs": 1209600000 },
                { "durationMs": 2592000000 }
              ],
              "allowCustom": true
            },
            "value": { "durationMs": 604800000 },
            "label": "Time Range"
          }
        ],
        "style": "pills"
      },
      "name": "parameters"
    },
    {
      "type": 12,
      "content": {
        "version": "NotebookGroup/1.0",
        "groupType": "editable",
        "items": [
          {
            "type": 3,
            "content": {
              "version": "KqlItem/1.0",
              "query": "SecurityIncident\n| summarize arg_max(TimeGenerated, *) by IncidentNumber\n| where Status != \"Closed\"\n| summarize Count = count()",
              "size": 4,
              "title": "Open Incidents",
              "queryType": 0,
              "resourceType": "microsoft.operationalinsights/workspaces",
              "visualization": "tiles",
              "tileSettings": {
                "titleContent": { "columnMatch": "Count", "formatter": 12, "formatOptions": { "palette": "redBright" } },
                "showBorder": false
              }
            },
            "customWidth": "16",
            "name": "open-incidents"
          },
          {
            "type": 3,
            "content": {
              "version": "KqlItem/1.0",
              "query": "SecurityIncident\n| summarize arg_max(TimeGenerated, *) by IncidentNumber\n| where Status != \"Closed\" and Severity == \"High\"\n| summarize Count = count()",
              "size": 4,
              "title": "High Severity",
              "queryType": 0,
              "resourceType": "microsoft.operationalinsights/workspaces",
              "visualization": "tiles",
              "tileSettings": {
                "titleContent": { "columnMatch": "Count", "formatter": 12, "formatOptions": { "palette": "magenta" } },
                "showBorder": false
              }
            },
            "customWidth": "16",
            "name": "high-severity"
          },
          {
            "type": 3,
            "content": {
              "version": "KqlItem/1.0",
              "query": "SecurityAlert\n| summarize arg_max(TimeGenerated, *) by SystemAlertId\n| summarize Count = count()",
              "size": 4,
              "title": "Alerts",
              "timeContextFromParameter": "TimeRange",
              "queryType": 0,
              "resourceType": "microsoft.operationalinsights/workspaces",
              "visualization": "tiles",
              "tileSettings": {
                "titleContent": { "columnMatch": "Count", "formatter": 12, "formatOptions": { "palette": "orange" } },
                "showBorder": false
              }
            },
            "customWidth": "16",
            "name": "total-alerts"
          },
          {
            "type": 3,
            "content": {
              "version": "KqlItem/1.0",
              "query": "SecurityIncident\n| summarize arg_max(TimeGenerated, *) by IncidentNumber\n| where Status == \"Closed\"\n| summarize Count = count()",
              "size": 4,
              "title": "Closed",
              "timeContextFromParameter": "TimeRange",
              "queryType": 0,
              "resourceType": "microsoft.operationalinsights/workspaces",
              "visualization": "tiles",
              "tileSettings": {
                "titleContent": { "columnMatch": "Count", "formatter": 12, "formatOptions": { "palette": "green" } },
                "showBorder": false
              }
            },
            "customWidth": "16",
            "name": "closed-incidents"
          },
          {
            "type": 3,
            "content": {
              "version": "KqlItem/1.0",
              "query": "SecurityIncident\n| summarize arg_max(TimeGenerated, *) by IncidentNumber\n| where Status == \"Closed\" and isnotempty(ClosedTime)\n| extend ResponseTime = datetime_diff('minute', ClosedTime, CreatedTime)\n| summarize MTTR = avg(ResponseTime)\n| project MTTR = iff(isnan(MTTR), \"N/A\", strcat(round(MTTR / 60, 1), \" hrs\"))",
              "size": 4,
              "title": "Avg Close Time",
              "timeContextFromParameter": "TimeRange",
              "queryType": 0,
              "resourceType": "microsoft.operationalinsights/workspaces",
              "visualization": "tiles",
              "tileSettings": {
                "titleContent": { "columnMatch": "MTTR", "formatter": 12, "formatOptions": { "palette": "blue" } },
                "showBorder": false
              }
            },
            "customWidth": "16",
            "name": "mttr"
          }
        ]
      },
      "name": "overview-tiles"
    },
    {
      "type": 12,
      "content": {
        "version": "NotebookGroup/1.0",
        "groupType": "editable",
        "items": [
          {
            "type": 3,
            "content": {
              "version": "KqlItem/1.0",
              "query": "SecurityIncident\n| summarize arg_max(TimeGenerated, *) by IncidentNumber\n| where Status != \"Closed\"\n| extend Age = datetime_diff('hour', now(), CreatedTime)\n| project\n    Title,\n    Severity,\n    Status,\n    Owner = tostring(coalesce(Owner.assignedTo, \"Unassigned\")),\n    CreatedTime,\n    Age = strcat(Age, \"h\")\n| order by case(Severity == \"High\", 1, Severity == \"Medium\", 2, Severity == \"Low\", 3, 4), CreatedTime desc\n| take 10",
              "size": 2,
              "title": "Open Incidents",
              "queryType": 0,
              "resourceType": "microsoft.operationalinsights/workspaces",
              "visualization": "table",
              "gridSettings": {
                "formatters": [
                  { "columnMatch": "Severity", "formatter": 18, "formatOptions": { "thresholdsOptions": "colors", "thresholdsGrid": [
                    { "operator": "==", "thresholdValue": "High", "representation": "redBright", "text": "{0}{1}" },
                    { "operator": "==", "thresholdValue": "Medium", "representation": "orange", "text": "{0}{1}" },
                    { "operator": "==", "thresholdValue": "Low", "representation": "yellow", "text": "{0}{1}" },
                    { "operator": "Default", "representation": "gray", "text": "{0}{1}" }
                  ]}}
                ]
              }
            },
            "name": "open-incidents-list"
          }
        ]
      },
      "name": "incidents-row"
    },
    {
      "type": 1,
      "content": {
        "json": "---\n## Alerts"
      },
      "name": "alerts-header"
    },
    {
      "type": 12,
      "content": {
        "version": "NotebookGroup/1.0",
        "groupType": "editable",
        "items": [
          {
            "type": 3,
            "content": {
              "version": "KqlItem/1.0",
              "query": "SecurityAlert\n| summarize arg_max(TimeGenerated, *) by SystemAlertId\n| summarize Count = count() by bin(TimeGenerated, 4h)\n| order by TimeGenerated asc",
              "size": 3,
              "title": "Alert Volume",
              "timeContextFromParameter": "TimeRange",
              "queryType": 0,
              "resourceType": "microsoft.operationalinsights/workspaces",
              "visualization": "linechart",
              "chartSettings": {
                "seriesLabelSettings": [{ "seriesName": "Count", "color": "orange" }]
              }
            },
            "customWidth": "50",
            "name": "alert-trend"
          },
          {
            "type": 3,
            "content": {
              "version": "KqlItem/1.0",
              "query": "SecurityAlert\n| summarize arg_max(TimeGenerated, *) by SystemAlertId\n| summarize Count = count() by AlertSeverity\n| order by case(AlertSeverity == \"High\", 1, AlertSeverity == \"Medium\", 2, AlertSeverity == \"Low\", 3, 4)",
              "size": 3,
              "title": "By Severity",
              "timeContextFromParameter": "TimeRange",
              "queryType": 0,
              "resourceType": "microsoft.operationalinsights/workspaces",
              "visualization": "piechart",
              "chartSettings": {
                "seriesLabelSettings": [
                  { "seriesName": "High", "color": "redBright" },
                  { "seriesName": "Medium", "color": "orange" },
                  { "seriesName": "Low", "color": "yellow" },
                  { "seriesName": "Informational", "color": "gray" }
                ]
              }
            },
            "customWidth": "25",
            "name": "alerts-by-severity"
          },
          {
            "type": 3,
            "content": {
              "version": "KqlItem/1.0",
              "query": "SecurityAlert\n| summarize arg_max(TimeGenerated, *) by SystemAlertId\n| summarize Count = count() by ProductName\n| order by Count desc",
              "size": 3,
              "title": "By Product",
              "timeContextFromParameter": "TimeRange",
              "queryType": 0,
              "resourceType": "microsoft.operationalinsights/workspaces",
              "visualization": "piechart"
            },
            "customWidth": "25",
            "name": "alerts-by-product"
          }
        ]
      },
      "name": "alerts-charts-group"
    },
    {
      "type": 12,
      "content": {
        "version": "NotebookGroup/1.0",
        "groupType": "editable",
        "items": [
          {
            "type": 3,
            "content": {
              "version": "KqlItem/1.0",
              "query": "SecurityAlert\n| summarize arg_max(TimeGenerated, *) by SystemAlertId\n| summarize Count = count() by AlertName = DisplayName\n| order by Count desc\n| take 10",
              "size": 2,
              "title": "Top Alert Rules",
              "timeContextFromParameter": "TimeRange",
              "queryType": 0,
              "resourceType": "microsoft.operationalinsights/workspaces",
              "visualization": "table",
              "gridSettings": {
                "formatters": [{ "columnMatch": "Count", "formatter": 4, "formatOptions": { "palette": "orange" } }]
              }
            },
            "customWidth": "40",
            "name": "top-alert-rules"
          },
          {
            "type": 3,
            "content": {
              "version": "KqlItem/1.0",
              "query": "SecurityAlert\n| summarize arg_max(TimeGenerated, *) by SystemAlertId\n| project TimeGenerated, AlertName = DisplayName, Severity = AlertSeverity, ProductName\n| order by case(Severity == \"High\", 1, Severity == \"Medium\", 2, Severity == \"Low\", 3, 4), TimeGenerated desc\n| take 10",
              "size": 2,
              "title": "Recent Alerts",
              "timeContextFromParameter": "TimeRange",
              "queryType": 0,
              "resourceType": "microsoft.operationalinsights/workspaces",
              "visualization": "table",
              "gridSettings": {
                "formatters": [
                  { "columnMatch": "Severity", "formatter": 18, "formatOptions": { "thresholdsOptions": "colors", "thresholdsGrid": [
                    { "operator": "==", "thresholdValue": "High", "representation": "redBright", "text": "{0}{1}" },
                    { "operator": "==", "thresholdValue": "Medium", "representation": "orange", "text": "{0}{1}" },
                    { "operator": "==", "thresholdValue": "Low", "representation": "yellow", "text": "{0}{1}" },
                    { "operator": "Default", "representation": "gray", "text": "{0}{1}" }
                  ]}}
                ]
              }
            },
            "customWidth": "60",
            "name": "recent-alerts"
          }
        ]
      },
      "name": "alerts-tables-group"
    },
    {
      "type": 1,
      "content": {
        "json": "---\n## Entities"
      },
      "name": "entities-header"
    },
    {
      "type": 12,
      "content": {
        "version": "NotebookGroup/1.0",
        "groupType": "editable",
        "items": [
          {
            "type": 3,
            "content": {
              "version": "KqlItem/1.0",
              "query": "SecurityAlert\n| summarize arg_max(TimeGenerated, *) by SystemAlertId\n| where isnotempty(Entities) and Entities != \"[]\"\n| extend EntityList = todynamic(Entities)\n| mv-expand Entity = EntityList\n| where Entity.Type == \"account\"\n| extend AccountName = coalesce(tostring(Entity.Name), tostring(Entity.AccountName), tostring(Entity.AadUserId))\n| where isnotempty(AccountName)\n| summarize AlertCount = count() by AccountName\n| order by AlertCount desc\n| take 5",
              "size": 2,
              "title": "Top Accounts",
              "timeContextFromParameter": "TimeRange",
              "queryType": 0,
              "resourceType": "microsoft.operationalinsights/workspaces",
              "visualization": "table",
              "gridSettings": {
                "formatters": [{ "columnMatch": "AlertCount", "formatter": 4, "formatOptions": { "palette": "redBright" } }]
              }
            },
            "customWidth": "33",
            "name": "top-accounts"
          },
          {
            "type": 3,
            "content": {
              "version": "KqlItem/1.0",
              "query": "SecurityAlert\n| summarize arg_max(TimeGenerated, *) by SystemAlertId\n| where isnotempty(Entities) and Entities != \"[]\"\n| extend EntityList = todynamic(Entities)\n| mv-expand Entity = EntityList\n| where Entity.Type == \"host\"\n| extend HostName = coalesce(tostring(Entity.HostName), tostring(Entity.NetBiosName))\n| where isnotempty(HostName)\n| summarize AlertCount = count() by HostName\n| order by AlertCount desc\n| take 5",
              "size": 2,
              "title": "Top Hosts",
              "timeContextFromParameter": "TimeRange",
              "queryType": 0,
              "resourceType": "microsoft.operationalinsights/workspaces",
              "visualization": "table",
              "gridSettings": {
                "formatters": [{ "columnMatch": "AlertCount", "formatter": 4, "formatOptions": { "palette": "orange" } }]
              }
            },
            "customWidth": "33",
            "name": "top-hosts"
          },
          {
            "type": 3,
            "content": {
              "version": "KqlItem/1.0",
              "query": "SecurityAlert\n| summarize arg_max(TimeGenerated, *) by SystemAlertId\n| where isnotempty(Entities) and Entities != \"[]\"\n| extend EntityList = todynamic(Entities)\n| mv-expand Entity = EntityList\n| where Entity.Type == \"ip\"\n| extend IPAddress = tostring(Entity.Address)\n| where isnotempty(IPAddress)\n| summarize AlertCount = count() by IPAddress\n| order by AlertCount desc\n| take 5",
              "size": 2,
              "title": "Top IPs",
              "timeContextFromParameter": "TimeRange",
              "queryType": 0,
              "resourceType": "microsoft.operationalinsights/workspaces",
              "visualization": "table",
              "gridSettings": {
                "formatters": [{ "columnMatch": "AlertCount", "formatter": 4, "formatOptions": { "palette": "blue" } }]
              }
            },
            "customWidth": "33",
            "name": "top-ips"
          }
        ]
      },
      "name": "entities-group"
    }
  ],
  "$schema": "https://github.com/Microsoft/Application-Insights-Workbooks/blob/master/schema/workbook.json"
}